Glaucomatous Macular Vasculature: A Quantitative Analysis
Medical hypothesis discovery and innovation in ophthalmology,
Vol. 9 No. 3 (2020),
9 June 2020
,
Page 185-197
https://doi.org/10.51329/mehdiophthal1403
Abstract
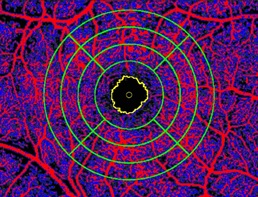
Background: The aim of this study was to evaluate the characteristics of the macular vessel density (VD) and the foveal avascular zone (FAZ) in glaucoma quantitatively using the optical coherence tomography angiography (OCT-A).Methods: Twenty-five eyes of 13 patients with primary open angle glaucoma (POAG) and 12 eyes of 6 healthy participants were enrolled retrospectively. Functional visual field (VF) and structural Spectral-Domain optical coherence tomography (SD-OCT) Retinal Nerve Fiber Layer Thickness (RNFLT) were assessed in all participants. OCT-A was performed on a fovea centered, 15x10 degrees, macular region. OCT-A scans were processed with MATLAB software and automatically graded to define FAZ parameters. The parafoveal VD in the superficial and deep retinal vascular plexus (SVP and DVP) was analyzed by quadrant and circular segmented zones.
Results: Foveal Avascular Zone -Major Axis Length (p=0.02), Area (p=0.04), Equivalent Diameter (p=0.04) and Perimeter (p=0.04) were significantly larger in glaucoma than the control group. Regarding SVP and DVP, the average macular total VD were lower in glaucoma patients compared to the control group (p<0.01; p<0.01). Additionally, the inner circular region (p=0.04; p<0.01 respectively for SVP and DVP) and all quadrants except for North had a lower VD in glaucoma group compared to the control group. Assessment of the total VD successfully predicted RNFLT (p<0.001) and was significantly associated with the probability of glaucoma (p=0.009).
Conclusion: OCT-A parameters, namely the FAZ morphology and the macular VD, were associated with glaucomatous functional and structural changes. The macular VD showed a considerable diagnostic value. It may be a modern biomarker, representing microvascular network disruption of the macular perfusion in glaucoma.
- Abstract Viewed: 3845 times
- Full Text PDF Downloaded: 219 times
